Ok, an imminent crash is coming. Do you panic? Run! Shout help?!
DON'T!
First, ask yourself if you are a trader or an investor.
Trader
If you are a trader going on the long side, then it's time to cut loss or look for an exit strategy. Then place yourself on the short side. Being nimble is key.
A trader thrives on volatility and nimbleness. Be it bull or crash, both are opportunities to profit from going short or long. The key is discipline in following a system.
Investor
If you are an investor, a crash is an opportunity to buy more of your favourite company at a lower price!
A crash is like a sale. When there are sales in shopping centres, throngs of people buy more. Yet when the stock market is giving a sale, people run. Is there any logic in that?
It's time to stay calm and rational, to define your money and risk management strategy in such turbulent times.

Stocks, Personal Finance, Personal Development,
Wealth, Income, Trading, Investing, Business
test4
Saturday, October 31, 2009
Friday, October 30, 2009
STI Updates
An interesting break down of the 50 MA by STI today, followed by a swift recovery. It appears that we have just finished an ascending triangle correction as in yesterday's chart (updated):

I'm expecting the end of the correction based on this. In fact, I bought into Singtel today as it is a strong index component.
However, from the MFI, lower lows are still being made... This is quite worrying at the moment.
As posted earlier, triangles like the one above are usually corrective waves, and always occur in the position prior to the final actionary wave in the pattern of one larger degree, i.e. wave four of an impulse, wave B of A-B-C, or final wave X in double or triple zig-zag or combination.
Also, in the stock market, when a triangle occurs in the fourth wave position, wave five is sometimes swift and travels approximately the distance of the widest part of the triangle.
The main thing I'm unsure right now is which wave this ascending triangle is in. I'm now starting to lean towards the idea that we are still in Major A of Primary B; that means Primary B might just be halfway through.
Reason?
The current wave feels like a wave 4, breathes like a wave 4, and behaves like a wave 4. The fourth waves are usually draggy, and often proves difficult to count.
It appears that wave 4 has ended right at the support line of the ascending triangle today.
Wave 5 will be beginning, or has already begun. Wave 5 personality is such that the news is almost universally bullish (USA positive GDP! Out of recession!). Bears will get severely ridiculed (think CSY in CNA forum). In addition, the fifth wave is where average investors start to buy in. Do beware. I have to admit that finally, there are quite a number of pple around me who do not practice TA, are starting to buy in, asking me if this stock is good to buy, telling me that the broker is saying this should be bought.
Some mathematics:
In the instance that we have indeed just completed a fourth wave, and taking into account the guideline that the 5th wave usually travels approximately the distance of the widest part of the triangle.
Widest part of triangle: 179.42
Likely possible end of wave 4: 2605.1
Possible final 5th wave target = 2605.1 + 179.42 = 2784.52
This coincides exactly with the 15 years resistance trendline!!!
See post here: http://wealthbuch.blogspot.com/2009/10/sti-updates-approaching-reversal-more.html
My final target remains at STI 2780 to 2790 region before any significant correction is seen.
Thursday, October 29, 2009
STI Updates
Today's price action warranted a recount of the waves. STI closed right at the 50 MA.
There appears to be 2 scenarios for STI.
The first scenario, my preferred count, is that we are in the 2nd wave of a 5th wave of larger degree:

In this first scenario, STI will be going up after reversing from 50 MA.
The second scenario is that we could still be in a mega 4th wave instead as shown in the chart:

This second scenario points to more upside for STI in a final wave 5.
Both scenarios pointed to a break on the upside. I lost $290 buying call warrants today at STI 2660, which didn't reverse upwards in time by close. In this, I learned a lesson that for me, if I'm bullish for STI, I should buy STI ETF instead as it does not have time decay. There's no leverage in the earnings, but I would lose less money and be able to keep it overnight.
At STI 2648 today, I'm expecting STI to achieve at least 2740 again. I might look into buying some stocks, or perhaps STI ETF, for the final rally. It all depends if STI will break the 50MA support with volume.
There appears to be 2 scenarios for STI.
The first scenario, my preferred count, is that we are in the 2nd wave of a 5th wave of larger degree:

The second scenario is that we could still be in a mega 4th wave instead as shown in the chart:

This second scenario points to more upside for STI in a final wave 5.
Both scenarios pointed to a break on the upside. I lost $290 buying call warrants today at STI 2660, which didn't reverse upwards in time by close. In this, I learned a lesson that for me, if I'm bullish for STI, I should buy STI ETF instead as it does not have time decay. There's no leverage in the earnings, but I would lose less money and be able to keep it overnight.
At STI 2648 today, I'm expecting STI to achieve at least 2740 again. I might look into buying some stocks, or perhaps STI ETF, for the final rally. It all depends if STI will break the 50MA support with volume.
Some Portfolio Updates
October has been a volatile month. I have made quite a bit of gains, and incurred a minor loss today.
Summary:
1) Sold Unit Trust (finally) with $255.30 gain. With this, I have zero Unit Trust left.
2) Bought and sold STI call warrant today with $290 loss. ========> Won't be doing this again. Loss will be taken against the 2 Unit Trust that were sold with a total profit of $300.
3) Sold half of my Macquarie International Infrastructure Fund at $0.405 due to a run up that was too fast. 16 lots left (averaged down from this sale) at $0.305. Will attempt to buy back at $0.37.
4) Bought in Berlian Laju for a trade (60 lots average $0.117)
5) Bought China Sky for trade (20 lots at $0.245)
In October, Starhub broke the 200 day MA and dropped big time. Fundamentally, the trigger could be due to the loss of BPL and ESPN exclusive broadcast rights and not being able to retail iPhone. However, I believe that Starhub will still be a good dividend counter, and I'm targetting <$1.85 to buy in (if I still have spare cash).
Capitaland broke resistance and went to $4.46. However, I did not sell it off as it came back down today to $4.15. It's likely to retest $4. Then again, my average price of $1.64 is very low, so I have zero worries.
Older stocks remaining in red are Hor Kew, LC Dev (cum dividend) and Cosco. Most others are in the green.
My portfolio paper gain at the current moment is about $7.5k, after including paper losses of $3k mainly from Cosco. This paper gain will likely drop further as the economy goes down again.
My realised gains in 2009 including dividends stand at $7.3k as well. More dividends are to be expected in Dec.
All in all, the cost of my portfolio stands at $84480, with $3k in CFD and $12218 in MMF as opportunity cash, giving me a total of $102600 excluding unrealised gains/losses. Pay day is near, and I would able to top up my MMF with new funds soon. Following that for Dec, it's AWS time, and I would be able to top up further.
I'm targeting (and hoping) to achieve $120k by the end of the year. That means $17.4k more. Not easy, not hard... Let's see how it goes...
Wednesday, October 28, 2009
Trading Loss
I was wrong with yesterday's count.... dead wrong :(
When STI was at 2660, I bought into STI Call Warrant for a quick intra-day trade. How wrong I was... With 21 lots at 0.19 and 4 lots at 0.185, I sold all at 0.18 because I did not want to keep it overnight for fear of the unknown and time decay. Inclusive of brokerage, I incurred a loss of S$290, my first realised loss. Leverage is indeed a double edged sword; it aids you when you are on the right path, but it kills you faster than anything else when you stepped on the wrong path.
It seems to me that I have made the right choice to cut loss when STI was around 2655 as the closing was 2648. If I hadn't, my paper loss would have been an extra $250. Perhaps it was fortunate I stuck to my original target stop loss and timeframe. A lesson learned.
Guess I should stick to what I'm more used to at the moment: buying (and probably trading) of high yielding dividend counters.
STI Updates
This is an intraday chart of yesterday:

It appears that the correction has completed. The main count is in this post
http://wealthbuch.blogspot.com/2009/10/sti-updates_25.html
It looks quite possible that Minute 2, Minor 3, Int 5, Major C, Pri B has completed.
In addition, it also appears that Minuette 1 of Minute 3 has started at 4pm yesterday and possibly completed. Minuette 2 should have started and to be continued today.
If my count is correct, we should see a down in the morning, followed by Minuette 3 of Minute 3, which should bring us way past 2700.
Let's see how it goes... Wave counts are getting more and more fractured, and this is a clear indication that a 5th wave of a larger degree is in action.
Tuesday, October 27, 2009
Capitaland
The recent run up in Capitaland's price has boosted my portfolio greatly.
Capitaland closed exact at the middle of the Friday's white candlestick, which is $4.3... In my weak understanding of candlestick formations, one of the support would be the middle of a long white candlestick. With this understanding of candlestick supports, the next support would be around 4.12 ~ 4.13

Capitaland closed exact at the middle of the Friday's white candlestick, which is $4.3... In my weak understanding of candlestick formations, one of the support would be the middle of a long white candlestick. With this understanding of candlestick supports, the next support would be around 4.12 ~ 4.13

STI Updates
Straits Times Index is getting harder and harder to understand... :(
Let's refer to the book Elliott Wave Principle: Key to Market Behaviour
In chapter 1, this paragraph is interesting:
The second paragraph adds on information on where the 5th wave is likely to end. The widest part of my triangle is 2700.78 - 2521.36 = 179.42. Supposed the 5th wave is the same distance, starting at 2576.84, it would be 2756.26. By trendline, 2790 is expected, which is quite close.
Earlier on, I mentioned that momentum divergences are common in 5th waves. Right now, triangles only occur in the final actionary wave. All these are telling me that my counts should be right, and that the 5th wave is indeed in action. The end might be coming soon.
However, there still likely some room for a little more upside. Based on Gann Hi-Lo Indicator, STI remains as bullish. Also, a short term morning star with confirmation (weak) was observed on STI over the last 4 days. Although Dow Jones is in the red now, STI might surprise with a green day tomorrow by close. However, this might be wrong as I didn't have the time to monitor the daily chart for counting.
Caveat emptor and good luck trading.
Let's refer to the book Elliott Wave Principle: Key to Market Behaviour
In chapter 1, this paragraph is interesting:
A triangle always occur in the position prior to the final actionary wave in the pattern of one larger degree, i.e. wave four of an impulse, wave B of A-B-C, or final wave X in double or triple zig-zag or combination.The following paragraph also presents interesting information:
In the stock market, when a triangle occurs in the fourth wave position, wave five is sometimes swift and travels approximately the distance of the widest part of the triangle.In my earlier wave count, the fourth wave was part of an ascending triangle. The first quoted paragraph should 'prove' the count right at the moment.
The second paragraph adds on information on where the 5th wave is likely to end. The widest part of my triangle is 2700.78 - 2521.36 = 179.42. Supposed the 5th wave is the same distance, starting at 2576.84, it would be 2756.26. By trendline, 2790 is expected, which is quite close.
Earlier on, I mentioned that momentum divergences are common in 5th waves. Right now, triangles only occur in the final actionary wave. All these are telling me that my counts should be right, and that the 5th wave is indeed in action. The end might be coming soon.
However, there still likely some room for a little more upside. Based on Gann Hi-Lo Indicator, STI remains as bullish. Also, a short term morning star with confirmation (weak) was observed on STI over the last 4 days. Although Dow Jones is in the red now, STI might surprise with a green day tomorrow by close. However, this might be wrong as I didn't have the time to monitor the daily chart for counting.
Caveat emptor and good luck trading.
Monday, October 26, 2009
Macquarie International Infrastructure Fund
Macquarie International Infrastructure Fund Limited (MIIF or Fund) today announced that it has agreed to sell 71.6 per cent of its interest in Macquarie European Infrastructure Fund (MEIF) to a number of financial investors for a total cash consideration of S$131.4 million (€63.0 million) (the Divestment). MIIF acquired this interest in MEIF for S$139.5 million in July 2005 and has received proportionate distributions of S$35.3 million (€17.4 million) from this investment. The Divestment is subject to customary closing conditions.
- The Divestment is at a 105.9 per cent premium to the value of MEIF implied by MIIF’s prevailing share price.
- The Divestment will enable MIIF to realise an internal rate of return of approximately 5.5 per cent on a proportionate basis.
MIIF will use a portion of the sale proceeds to repay the drawn balance of its debt facilities of approximately S$19.0 million. The remainder of the proceeds will be retained by MIIF to provide balance sheet flexibility for the Fund. Options available to the Board include reinvestment of the proceeds, share buy-back or payment of a special dividend, if it considers such an action to be beneficial to shareholders.
**************************************************
I consider this a good news. The divestment is in line with MIIF's intentions to pare down it's European assets to focus on the Asian portion.
As I type this, MIIF has ballooned to near 40 cents, giving me a paper gain of almost 1.2k at the moment, more than sufficient to cover the other penny stocks.
However, there are still some who are a little more concerned about it's fundamentals. The magazine, Pulses, had a write-up in their Oct 09 issue. I shall do an overview on it when I find the time to do so.
STI Updates
The new Gann indicator I'm testing out has swung to a positive. It does look that another mini bull run is about to begin.
However, with the Dow's crash on Friday, I believe that STI might retrace and/or consolidate further before advancing towards my eventual target of 2790.

Given the possible performance of STI, this is the best-fit elliott wave count I have at the moment. We will likely be beginning minute wave ii, which coincides with my expected retracement. The likely targets are 2710 (23.6%), 2703 (38.2%), 2698 (50%) and 2694 (61.8%). I expect the maximum pull back, if any, to be around psychological point 2700, so 2703 and 2698 will be possible targets.
In the very short term, no negative divergence was observed on the daily chart. 2790 target remains intact.
Friday, October 23, 2009
STI Updates
Gann Hi-Lo Activator continues to advocate a down of STI (in testing mode)
In addition, I will be using MFI instead of RSI in my attempt to read market divergences from now on, because MFI takes into account volume.
Overall, STI achieved a 38.2% retracement to rebound at 2677 today. Whether this rebound will sustain at this portion depends largely on the performance of US tonight. At the moment, Dow is up by 80 points.
Looking at the indicators, Chaikin Money Flow looks even more negative. Both MFI and MACD are showing divergences. Stochastics has crossed over to the negative side a few days ago. Upside is looking very limited at the moment. However, I believe STI will still touch 2790 before a reversal.
In short, STI looks likely to open green, to achieve 2700 tomorrow morning before a short retracement. However, it does appear that a correction is imminent in the mid term. It's a time to beware and be cautious.
Latest update:
I posted this in the morning in CNA forums. Posting here as well.
Some mini portfolio updates:
Following my analysis and expectations that STI is nearing 15 years resistance at around 2790, I have raised a sell order for my Unit Trust, First State Dividend Advantage, on Tuesday. I was fortunate to achieve about 5% profit after 1 year... having bought at a price which I deemed too high in terms of valuations. The money will be left in the money market fund and kept as opportunity fund.
Starhub, in my portfolio, looks set to get weaker. I had bought 3 lots at 1.91 about half a year ago, and received dividends twice. As an investor in this share, and having analysed earlier about Starhub, I believe that Starhub would be sustainable as a business. Telco is afterall a sector that is defensive. The happy FA investor in me is telling me to prepare to average down; while the TA trader in me is telling me that there's more downside to come. Combining the two analyses together, I have decided to bid my time and wait to put money into Starhub for long term (by FA) when TA tells me it's time. This will be posted in a separate post soon over the weekend.
In addition, I will be using MFI instead of RSI in my attempt to read market divergences from now on, because MFI takes into account volume.
Overall, STI achieved a 38.2% retracement to rebound at 2677 today. Whether this rebound will sustain at this portion depends largely on the performance of US tonight. At the moment, Dow is up by 80 points.
Looking at the indicators, Chaikin Money Flow looks even more negative. Both MFI and MACD are showing divergences. Stochastics has crossed over to the negative side a few days ago. Upside is looking very limited at the moment. However, I believe STI will still touch 2790 before a reversal.
In short, STI looks likely to open green, to achieve 2700 tomorrow morning before a short retracement. However, it does appear that a correction is imminent in the mid term. It's a time to beware and be cautious.
Latest update:
I posted this in the morning in CNA forums. Posting here as well.
Looking at the hourly (or 15 mins?) chart from Yahoo Finance, my crystal ball suggests that a mini wave 3 of bigger wave 5 is about to begin today, or has already begun yesterday (likely). 2700 likely to be touched and breached if this is true...
I'm not very sure, but I'm still thinking that this is the 5th wave of major C...
Some mini portfolio updates:
Following my analysis and expectations that STI is nearing 15 years resistance at around 2790, I have raised a sell order for my Unit Trust, First State Dividend Advantage, on Tuesday. I was fortunate to achieve about 5% profit after 1 year... having bought at a price which I deemed too high in terms of valuations. The money will be left in the money market fund and kept as opportunity fund.
Starhub, in my portfolio, looks set to get weaker. I had bought 3 lots at 1.91 about half a year ago, and received dividends twice. As an investor in this share, and having analysed earlier about Starhub, I believe that Starhub would be sustainable as a business. Telco is afterall a sector that is defensive. The happy FA investor in me is telling me to prepare to average down; while the TA trader in me is telling me that there's more downside to come. Combining the two analyses together, I have decided to bid my time and wait to put money into Starhub for long term (by FA) when TA tells me it's time. This will be posted in a separate post soon over the weekend.
Thursday, October 22, 2009
Millionaires -- Jolin Tsai
This is an interesting piece of news. Moral of the story: work hard, work smart.

Jolin Tsai's fortunes now worth S$60 million
Jolin Tsai's fortunes now worth S$60 million
Taiwanese pop princess Jolin Tsai first made her debut onstage in 1999 with her album, Jolin1019. Her cutie-pie good looks won over the hearts of many fans and sealed her standing in the entertainment industry.
Although Jolin's conflict with her previous management company over contract issues in 2001 proved to be threatening, the pop princess made a glorious comeback in 2003 with her hit music album, Magic.
In this period of time, Jolin worked on her career and continued to release six other music albums. She took on drama series, advertorials, wrote books and even branched out to the fashion industry with her own clothing label, 72 Changes. Within these 10 years, she has amassed a wealth of S$60 million and owns three houses with a total market value of S$9.75 million.
Thankful for her fan's everlasting support , Jolin wrote on her blog, "I would like to thank the cute children who have accompanied the princess through many ups and downs"
"You guys always say that the princess is your pride and energy. Actually, 'you guys' are my strength and pride. Without all of you, I don't think the princess will be able to make it through and feel all your love."
Previously busy with the album promotions for her latest music album, Flower Butterfly, Jolin will be taking a one-month break and will tour various countries in Europe together with her older sister.
STI Updates
The market just doesn't make it easy for us to understand :(
It seems tougher and tougher to read the market nowadays.
I was reading through on Gann Analysis when I come across this indicator: Gann Hi-Lo Activator. According to this indicator, it appears that STI has crossed into down-trend territory. Will monitor more on this indicator, and possibly do some back testing when I have the time.

It appears that the rally is coming to an end. On deeper analysis now, I believe I was dumb to attempt to punt and beat the market in the following
Fresh:
Berlian Laju (28 lots @ 0.125, now 0.120 down $140)
China Sky (20 lots @ 0.245, now 0.235 down $200)
Stale:
Hor Kew (30 lots @ 0.125, now 0.115 down $300)
LC Dev (20 lots @ 0.21, now 0.20 down $200)
If I were to sell all right now at a loss, I would incur a loss of $840 + $240 brokerage, about $1k.... Ouch! Considering that my realised profits are about $7k so far, I should treat it as returning some profits to the market :( Fortunately, I still have some unrealised profits for buffer...
I guess I would need to be very cautious to cut loss... The paper loss might balloon a little more before I cut...
Wednesday, October 21, 2009
STI Updates
From the intra-day chart, it appears that STI has finished a 50% fibonacci retracement over the last 2 days

2681~2729 (48 pts)
2729 ~ 2705 (24 pts = 50% of 48)
It appears as if it is a mini degree wave 1 and 2 some larger wave. The maximum for wave 2 retracement will be 2681 because wave 2 cannot cross wave 1. My expectation is a retracement to 2700 (61.8%).
We should be expecting a mini wave 3 of some sort soon. 2740 will likely be broken in coming days if this count is true.
As usual, Caveat Emptor.
Tuesday, October 20, 2009
STI Updates
Classic pullback today to retest 2680 (a favourite sticky point) before moving up to end at 2711 today.
My daily EW counts have been violated with the breaking of 2685 (wave 4 crossed into wave 1). And after re-looking at the charts, I have re-labelled my wave counts to adjust

It appears from the daily chart that STI has completed a 3 waves zig zag correction downwards.
A fifth wave is in the works to likely bring STI to break 2740.
The million dollar question now is, will these 5 waves be minor 5 of int C, or are these 5 waves merely part of minute 1 of minor 5 of int C. Afterall, the supposed timeline so far for the waves for my preferred counts are
1: 8 days
2: 5 days
3: 1 month
4: 2 months
5: ?????? (11 days so far)
Shall see how it goes; I'm expecting a greenish day of bullishness for tomorrow.
Monday, October 19, 2009
US Dollar -- Time to say bye?
Much of the rise in the stock market has been attributed to the fall of the US dollar. But will the fall of the USD be sustained? Let's look at it from both the technical and fundamental point of view.
For the technical portion, I shall take a leaf from Elliott Wave International's technical viewpoint on the elliott wave count
http://www.elliottwave.com/freeupdates/archives/2009/10/13/U.S.-Dollar-Kiss-Goodbye-or-Reversal-at-Hand.aspx

Notice the drop since March 09? This is in line with the multi bear rally from Mar 09 in stock indices. An inverse relationship is obvious between equities and the dollar.
Thoughts on Financial Freedom -- 3
On having plans
How many times have we hear this from the 'gurus'? We must have a vision, we must have a goal, we must have a target. "YES, I WANT FINANCIAL FREEDOM! I WILL ACHIEVE FINANCIAL FREEDOM!" Then after that, we are riled up to be very motivated to achieve this goal, and believe that we can achieve it...
Then?
Financial freedom is a destination. And like any other destination, a path, a route, is needed. However, paths and routes are always full of hidden dangers and traps; there may be dust, rocks, crevices, which are evilly 'placed' there to trip you up in your journey. And just like any important trip or journey we are taking, to travel along this path towards financial freedom, we need to plan and prepare well so that the probability of completing the journey is higher. Wanting it and being motivated alone won't get us there.
A plan is needed. A plan to follow. A plan to succeed.

My plan is simple.
1) I have a full time job.
2) I teach tuition.
3) I invest for growth and dividends.
4) I attempt to trade.
5) I have 2 blogs with adsense and nuffnang.
6) I put up some articles from my blogs to associatedcontent.com
and
7) I'm planning to write educational books on my tips to scoring for O and A level exams.
My plan includes 6 different streams of income, plus a possible 7th in the making. So far so good...
How about your plans? Have you made yours?
Sunday, October 18, 2009
STI Updates
This is a continuation from the previous post, and also continued from the previous STI hourly count:
http://wealthbuch.blogspot.com/2009/10/sti-hourly-elliott-wave-practice.html
Right now, as a continuation, the current week's count is as follows:

It appears that the Minuette 3 of Minute 3 of Minor 5 of Int C of Pri B was the wave that broke through the 2700 STI resistance. Following that was Minute 4 with 3 clear Minuette waves that ended at 2701.59. Excluding a complex count, I believe that Minute 5 has started on Friday with the first 2 waves as shown.
Following this preferred count, Monday might open red and close green, with Minuette 2 ending and Minuette 3 beginning.
Combining the daily hourly counts, on the daily chart on ChartNexus:

As we draw closer to the end of the rally, the news will get more and more bullish, which is what is happening right now.
Do take note that bull runs or bear rallies end on positive news, not negative news.
I'm expecting the top to be near the 2780 to 2790 region (highest probability), followed by 3000 and then 3200. The upside is indeed limited for mid-term investors/traders, and I will be looking to sell off my Unit Trust (First State Dividend Advantage) soon. I might be wrong, but to me, the upside potential is lesser than the downside potential since STI has crossed the 50% fibonacci level. The trigger to do so will be a surge in STI to confirm my wave counts.
Take note also the divergence present in STI in RSI and MACD (second time I'm mentioning :p).
I will be listing my strategies for my other holdings in a separate post soon.
As usual, Caveat Emptor. Do share if you have a different analysis.
http://wealthbuch.blogspot.com/2009/10/sti-hourly-elliott-wave-practice.html
Right now, as a continuation, the current week's count is as follows:

Following this preferred count, Monday might open red and close green, with Minuette 2 ending and Minuette 3 beginning.
Combining the daily hourly counts, on the daily chart on ChartNexus:

As we draw closer to the end of the rally, the news will get more and more bullish, which is what is happening right now.
Do take note that bull runs or bear rallies end on positive news, not negative news.
I'm expecting the top to be near the 2780 to 2790 region (highest probability), followed by 3000 and then 3200. The upside is indeed limited for mid-term investors/traders, and I will be looking to sell off my Unit Trust (First State Dividend Advantage) soon. I might be wrong, but to me, the upside potential is lesser than the downside potential since STI has crossed the 50% fibonacci level. The trigger to do so will be a surge in STI to confirm my wave counts.
Take note also the divergence present in STI in RSI and MACD (second time I'm mentioning :p).
I will be listing my strategies for my other holdings in a separate post soon.
As usual, Caveat Emptor. Do share if you have a different analysis.
Friday, October 16, 2009
STI Updates -- Approaching Reversal (A more bearish view)
Yesterday's post presented a more bullish view that STI might reach 3200. Today's post explores on the possibility of reversing at or near 2790.
Upon a closer look, the long term resistance is approaching.

It appears that STI might top out at near the 2800 (estimated) region. The timeframe could likely be by November to December 2009, where the 2 major trendlines converges:

The horizontal purple line was a peak of STI on 3rd May 2006 at 2666.3. It appears that during the recent sideways market, STI hovered and played around this region for a long time before finally breaking upwards.
Estimated target is around 2790 for reversal in this scenario.
In terms of Elliott Wave counts, do take note that
1) The news is almost universally bullish
2) The glaring negative divergence in MACD and RSI. Even though new highs are made, MACD and RSI did not rise to portray that.
These 2 evidences are likely pointing to a 5th wave now. But I might be wrong though. But fact is, anything above STI 2790 is treading on dangerous ground.
Caveat Emptor.
Thursday, October 15, 2009
Possible STI Performance? -- The Update
This is from the previous post here dated 30th Sep 2009
http://wealthbuch.blogspot.com/2009/09/possible-sti-performance.html
It appears that Act 1 Scene 3 is in action...
The above was originally coined by thinking along the lines of EW theory... Might not be true though... It's just for fun, although the first 2 scenes seemed to have come true... Caveat Emptor...
I will be re-looking and re-calculating my waves tonight because I seriously believe 3200 is quite unachievable...
http://wealthbuch.blogspot.com/2009/09/possible-sti-performance.html
Act 1 Scene 1: Lots of pple waiting for window dressing to sell higher. That means there won't be window dressing... Likely to remain stagnant till Oct...
Act 1 Scene 2: A lot of people are getting cautious of October, so likely to rise up somewhere in October.
Act 1 Scene 3: People start to believe October this year wasn't a bad month after all. All prepare for year end rally, start to buy more and more. Market will then become toppish
Act 1 Scene 4: Indeed Year end rally! Buy more! Market tops. End of final wave. Target timeline: November. Start of wave 1 downwards.
Act 2 Scene 1: People start to sell, believing market has topped. Market u-turns go up for year end rally till Jan. Start of wave 2 upwards.
Act 2 Scene 2: People start to believe market rally hasn't end yet. Buy back some. Some happy that they bought back cheaper. Market turns again for wave 3 down. Feb 2010.
It appears that Act 1 Scene 3 is in action...
The above was originally coined by thinking along the lines of EW theory... Might not be true though... It's just for fun, although the first 2 scenes seemed to have come true... Caveat Emptor...
I will be re-looking and re-calculating my waves tonight because I seriously believe 3200 is quite unachievable...
STI Updates
STI broke upwards of the rising wedge against my original expectations, something which was achieved on S&P500 earlier. Indeed, this is a very bullish signal.
I have relabelled the recent correction (and as wave 4) as below:

MACD has turned positive as well. Overall, the sentiments are also very bullish. However, are all very well?
Referring back to previous posts.
http://wealthbuch.blogspot.com/2009/10/sti-long-term-chart.html
http://wealthbuch.blogspot.com/2009/10/sti-elliott-wave-updates.html
http://wealthbuch.blogspot.com/2009/10/sti-updates-more-bull-to-come.html
It appears that the following count might be the most "correct" at the moment

The alternate count would be, the end of intermediate B might be at the next label (2) instead, resulting in a running flat. If this was true, the next wave would be an intermediate wave 3 (super bullish) instead of an intermediate wave 5 (moderately bullish). Either way, we have a bullish impulse wave upwards, which will occur in 5 subwaves.
Let's recap the wave personalities from wiki:
Because of the sentence in red, I would classify it as a wave 5 because most news are now quite bullish and bears were ridiculed badly.
However, wave C tends to extend wave A by 1.618 and beyond... The wave principle generally applies more accurately to waves of larger degrees. For my wave A (1455~2424), 161.8% for wave C would give us another 969 points rise from wave B (either end at 2211 or 2235). For a wave 5 right now (means B end at 2211), we are looking at 3779, and for a wave 3 right now (means B end at 2235), we are looking at STI 3802 at the maximum likelihood. But this is a bit much too bullish to fathom.
Instead, if wave C is equalled to wave A in magnitude, 3200 sounds like a more likely target. But is that also too bullish to fathom? For me, it sounds like it... :(
Do bear in mind, we have the critical 61.8% fibonacci retracement level at the 2970 region and the 71.6% fibonacci retracement level at 3200. Could 3200 happening twice be a coincidence?
I guess we have to watch how the waves unravel themselves, and if 3200 is really achievable. I'm still at the learning stage; there's just so much more to learn...
I have relabelled the recent correction (and as wave 4) as below:

MACD has turned positive as well. Overall, the sentiments are also very bullish. However, are all very well?
Referring back to previous posts.
http://wealthbuch.blogspot.com/2009/10/sti-long-term-chart.html
http://wealthbuch.blogspot.com/2009/10/sti-elliott-wave-updates.html
http://wealthbuch.blogspot.com/2009/10/sti-updates-more-bull-to-come.html
It appears that the following count might be the most "correct" at the moment

The alternate count would be, the end of intermediate B might be at the next label (2) instead, resulting in a running flat. If this was true, the next wave would be an intermediate wave 3 (super bullish) instead of an intermediate wave 5 (moderately bullish). Either way, we have a bullish impulse wave upwards, which will occur in 5 subwaves.
Let's recap the wave personalities from wiki:
Wave 3: Wave three is usually the largest and most powerful wave in a trend (although some research suggests that in commodity markets, wave five is the largest). The news is now positive and fundamental analysts start to raise earnings estimates. Prices rise quickly, corrections are short-lived and shallow. Anyone looking to "get in on a pullback" will likely miss the boat. As wave three starts, the news is probably still bearish, and most market players remain negative; but by wave three's midpoint, "the crowd" will often join the new bullish trend. Wave three often extends wave one by a ratio of 1.618:1.
Wave 5: Wave five is the final leg in the direction of the dominant trend. The news is almost universally positive and everyone is bullish. Unfortunately, this is when many average investors finally buy in, right before the top. Volume is lower in wave five than in wave three, and many momentum indicators start to show divergences (prices reach a new high, the indicator does not reach a new peak). At the end of a major bull market, bears may very well be ridiculed (recall how forecasts for a top in the stock market during 2000 were received).
Because of the sentence in red, I would classify it as a wave 5 because most news are now quite bullish and bears were ridiculed badly.
However, wave C tends to extend wave A by 1.618 and beyond... The wave principle generally applies more accurately to waves of larger degrees. For my wave A (1455~2424), 161.8% for wave C would give us another 969 points rise from wave B (either end at 2211 or 2235). For a wave 5 right now (means B end at 2211), we are looking at 3779, and for a wave 3 right now (means B end at 2235), we are looking at STI 3802 at the maximum likelihood. But this is a bit much too bullish to fathom.
Instead, if wave C is equalled to wave A in magnitude, 3200 sounds like a more likely target. But is that also too bullish to fathom? For me, it sounds like it... :(
Do bear in mind, we have the critical 61.8% fibonacci retracement level at the 2970 region and the 71.6% fibonacci retracement level at 3200. Could 3200 happening twice be a coincidence?
I guess we have to watch how the waves unravel themselves, and if 3200 is really achievable. I'm still at the learning stage; there's just so much more to learn...
The Enlightenment About Passive Income
Came across this nice article while surfing my gf's blog's archives when she took this nice article from somewhere to post. Enjoy:
Author: A. Annika Smith
If you search the internet for “passive income”, you may find a definition or two, but mostly, what you find are web sites trying to sell you on the passive-income-flavor-of-the-day. It’s frustrating, I know. I don’t know about you, but before I jump into any opportunity or even before I take a trip, I like to do my research. That being said, there are a lot of good opportunities out there. But before you start spending money, let’s discuss what passive income is and, most importantly, what it isn’t.
Webster’s dictionary defines passive income as “of, relating to, or being business activity in which the investor does not have immediate control over income”. I don’t think that tells the
whole story. Passive income is money that you receive over and over again without having to do much work (notice I didn’t say “any work”). It is different than earned income in that you are
not receiving money for your time (like you would a job). But depending on the passive income stream that you choose, you may in fact have immediate control over your income. But I’ll get to
that later.
Why would you want passive income? Well, like Robert Kiyosaki explains in his book “Rich Dad Poor Dad”, that is the main difference between the rich and the middle class. The rich invest their money in various passive income streams. When their passive income exceeds their expenses, then they are financially free. “Financially free” simply means that you do not have to
have a day job to pay your expenses. And you are “free” to then do whatever you want!
What Passive Income Isn’t
Before I go into telling you what passive income is, let me first tell you want it isn’t. Passive income is not the same thing as “residual income”. Residual income is money that you receive on a regular basis after having done work once. The best example would be TV sitcoms. Some actors get “residuals”. Actors get paid for filming the show. Afterwards, some actors get paid
each time the show repeats. Sales people that sell services, subscriptions, or renewable products (like insurance) sell that item once and, providing the customer renews, will get a commission off of each renewal. Royalties from the sale of books and music are also residual.
Many say that multi-level-marketing or network marketing sales provide you with passive income. Guess what? That’s residual too.
If you have a small business or are self-employed, even if you are making a lot of money, this is NOT passive income. If you receive a salary from your business, that is earned income. There is a way to turn this into passive income, however — so stay tuned.
You know, I have to say that starting your own web site cannot be passive income. Whether you are selling a product (such as an eBook, seminar or other information) or a service, you still
have to market your web site. You will have to do this regardless of whether you are selling your OWN products or have the rights to sell other’s products. Marketing your web site is work, simple as that. But it’s not a job. And once your marketing efforts start taking off, you can make a lot of money with little additional effort. But that is residual in my book, not passive.
What Passive Income Is
Passive income is a lot of things. The first thing that comes to mind, and also, I believe, the most popular example is real estate. If you own investment property and are getting a positive cash flow from a house, commercial property, or apartment, that is passive income. If you rent rooms in your house, that’s passive income too. You only have to set this up once, and then the income comes in month after month. Interest income from savings accounts, CDs, and money-market accounts are passive — the bank pays you for keeping your money in those accounts. If you have a web site with banner ads or Google Adsense ads, that can be called passive as well.
If you invest in any business, but don’t manage it, your profits are considered passive income, exactly what Webster was thinking about when he wrote the definition.
What about business? Well, that depends on how you set it up. Rich people create businesses and set up a system that the business follows. That way, if the owner goes on vacation for a
month to Fiji, the employees follow the system and the owner still gets the profits. Any business will of course start out with a lot of work, but if you take the time to set up a business so that it gets reproducible results (exactly like a franchise), those profits become passive. And, according to the IRS, any salary you get from your business is considered “earned” but profits are considered “passive”. It is vital when starting a business to check with an accountant and an attorney to set up your business that financially benefits you the best.
What else can be considered passive income? How about self-storage facilities, parking garages/lots and dry cleaners! They all require some time to start up, but once they are set
up, you collect money over and over again.
Residual vs Passive Income
Residual and passive income are like siblings. They are both very similar and most people really consider them synonyms. What does it matter, anyway? They are both excellent ways to get
money in your hands month after month after month without trading your time or your freedom. How can it get better than that?
Reality Check
Beware of anyone that tells you that there is NO work involved in passive income. Passive income does not mean no work! If you are going to invest in a business, a stock, or a real estate
property, you will have to do your research (this is called “due diligence”). Research is work! You will also be required to manage your investments, to check up on their progress and make changes as necessary. That’s work too!
The good news is that research and management is only a part-time endeavor. And most of the time, that work can be done from almost anywhere, including on a beach in Fiji.
Let us not forget the FUN factor. I’m sure there are some of you reading this who like, even love their jobs (if you still have one). Some of you have your own business– and congrats to you! But most of us are in jobs just because we need to feed our families and pay the bills. Looking into passive income streams and investing your time and money can bring you many, many
returns. Researching for and implementing your passive income plans so that you can live your dreams is FUN. Getting money every month, week, or even every day is FUN. And trying out new strategies and managing your money — when you have some to manage — is FUN.
I hope I’ve done my job and given you the passive income basics. If you have any questions or thoughts, feel free to contact me through my web site I’d love to hear from you!
About the author:
Annika Smith is dedicated to teaching others how to be not only
financially free, but also wealthy and happy
Wednesday, October 14, 2009
STI Updates
The reason for mentioning 2686 today. Chart here:

Seems like tomorrow will have a big movement... Of course, I could be wrong as a broadening rising wedge might result instead.
I'm still staying sidelines till further confirmation signals are abound. Personally, I'm expecting a breakdown of the rising wedge, resulting in a small time correction down to around 2630, which is the 50 day MA line, before any further upside.
Or will STI take out 2686 to break above the resistance line, symmetrical triangle and rising wedge soon to portray an extremely bullish scenario? Let's just watch the show.
Tuesday, October 13, 2009
STI Updates
A little rushed, so no charts in this post.
STI faces strong resistance at 2686 today
1) rising wedge (1 week) resistance
2) symmetrical triangle (1 month) resistance
3) 50% fibonacci retracement level
4) horizontal resistance point if we join a few peaks.
It looks unlikely that this level will break today. If it does break with high volume, it's a very bullish signal.
Singtel vs Starhub
With Starhub being part of my dividend basket, I feel that it is necessary to look into the recent hoo-ha about the pay-TV competition between these two firms.
Starhub lost the rights to broadcast EPL, ESPN, STAR Sports and STAR Cricket to Singtel, who outbid Starhub for them, and this explains the plunge of Starhub from $2.16 to $1.94, which rebounded to $2 today.

This raises the question... is an oligopoly the way to go for Pay-TV market in Singapore? Competition is usually good for consumers, as we learn from basic Economics 101. However, in this case, it seems that competition might just not be good for consumers because, also from Economics, Singapore is so small that this market might be a natural monopoly.
Starhub lost the rights to broadcast EPL, ESPN, STAR Sports and STAR Cricket to Singtel, who outbid Starhub for them, and this explains the plunge of Starhub from $2.16 to $1.94, which rebounded to $2 today.
This raises the question... is an oligopoly the way to go for Pay-TV market in Singapore? Competition is usually good for consumers, as we learn from basic Economics 101. However, in this case, it seems that competition might just not be good for consumers because, also from Economics, Singapore is so small that this market might be a natural monopoly.
Monday, October 12, 2009
STI Updates -- Cup and Handle formation?
With all the confusing Elliott Wave counts, perhaps it's time to get back to basic chart patterns to give us a better idea of what could be happening.
It appears that STI is forming a cup and handle pattern since 4th August till now, over the course of nearly 9 weeks.

In the book "Applying Elliott Wave Profitably", by Steven W. Poser, he mentioned that he had always found it difficult to tie in an Elliott Wave into a cup and handle formation at times. Indeed, not only has Elliott Wave International mentioned in their short term update (which I read during their freeweek) that they cracked their heads into fitting a wave count, there have also been many discrepancies between the wave counts of Elliott Wave analysts.
Tip: Google with the search key "cup and handle elliott wave" and access the google ebook portion. It should be the first result.
As in the previous yahoo chart count, 5 super mini waves have been counted. It would be bullish to see a reversal down to STI 2610 (61.8% retracement and the upper green line on the handle of the cup), before a powerful wave upwards...
In summary, I'm leaning more towards a bullish rise. Bears should be careful, and bulls should watch out for opportunities. Caveat emptor and good luck trading.
P.S. But do bear in mind that cup and handle formations can fail. Example, between Nov 08 and Mar 09, there was an inverted cup and handle.
Sunday, October 11, 2009
MacQuarie International Infrastructure Fund Technical Analysis
This post is on analysing Macquarie International Infrastructure Fund (MIIF) technically. For the recent fundamental analysis on this, please click here.

As we can see from the chart, MIIF bounced off the 200 day MA recently, and has hit and bounced down the 50 day MA. If it crosses this 50 MA, it will be very bullish, and likely go all the way to 40 cents, the blue resistance line.
However, %R is rather high and has made a turn. Furthermore, the 50 day MA looks like a formidable wall; it has been hit 3 times recently. There might likely be a correction down to 32~33 cents before going up again; i.e. ding dong back down to 200 day MA plus support line, then go up.
I might just load more around 32~33 cents to average down. Fundamentally good (at least to me) and looks good technically :)
Saturday, October 10, 2009
Thoughts on Financial Freedom -- 2
On Expenditure
If financial freedom really financial freedom if you have to scrimp and scrimp so that you spend less than you earn from passive income? I wouldn't think so.
I mean, all the talks about "it's about spending less than what you earn"... are too generic and doesn't contain sufficient information. It's just like a person who is dieting by eating less and less till he/she reaches his/her normal weight. Works? Definitely for the short term, but in the long run, it will result in a disastrous yo-yo diet syndrome where he/she will just get fatter and fatter.
The best way to get a healthier body fat ratio (or whatever) is a change in lifestyle, i.e. your choice of food, your planning of time for exercises, sleep, etc. Similarly, the best way to financial freedom is a change in lifestyle in spending habits, in choice of activities you do, choice of income sources, planning of cash flows and movements, etc. In both cases, nothing can be achieved overnight; having a clear goal in mind with meticulous planning and discipline is of paramount importance. And, you have to be happy with your lifestyle, and not be complaining everyday it's so tough to maintain your low expenditure lifestyle, but you have achieved financial freedom.
For example, my average monthly dividends is about $450. If my expenditure is <$450 monthly, I could claim I have achieved financial freedom! But what would my lifestyle be? $100 for instant noodles every meal for the month? Zero recreational activities, zero fan, zero air-con, no need for housing, etc... You get my drift...
Financial freedom is about having the choice to do what you like normally with little or no worries about money.
Of course, I'm not talking about financial abundance, where you could have your dream lifestyle with no worries about money. It's more about maintaining your current lifestyle with no worries, i.e. the food you eat, the recreational activities you do, the way you travel, etc.
Financial freedom is a way of life.
Just like a life of keeping fit and healthy is a way of life, financial freedom is about your way of life too. It's about your habits, the things you do, the way you see and analyse events, that shape your financial health.
In the world of bodybuilding, we say you are what you eat. So if you eat junk food, you will look like junk. Bring that to our financial status; you are what you do. A good plan and goal will result eventually in good financial health.
Financial freedom is a mindset.
You could be earning $100k in passive income a year, yet you are still not in financial freedom. Doesn't this reek of anorexic people who keep telling everyone they are still too fat? It's about how you see yourself, how you see your financial health. There's no point comparing with others. The most important thing in life is to be optimistic, and satisfied with what was given to us, be it intellectually or financially. Afterall, after another 100 years, all will be gone from us right? We will just be another dust below the soil.
Friday, October 9, 2009
STI (Hourly) Elliott Wave Practice
This is my attempt on counting waves on the hourly chart over 5 days using Yahoo's chart during lunch time. Chart is drawn on MS Word, so it's a little shoddy.

Looks like there's some further upside after lunch, before we see a A-B-C down and breaking the rising wedge being formed on the hourly.
Basic Elliott Wave Structure:
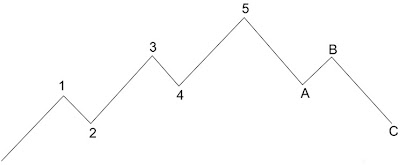
It does look like STI will go to around 2665, then move down to 2630 to form the A wave by Monday. If true, we will see STI peak later, then close lower by 5pm, forming a inverted V-shape today. Monday will see 2630 before a rebound to 2655 region, then another down, completing a head and shoulders.

Looks like there's some further upside after lunch, before we see a A-B-C down and breaking the rising wedge being formed on the hourly.
Basic Elliott Wave Structure:

Caveat emptor, this is just an experiment to test out Elliott Wave Fractal Theory. Of course, my counts might be wrong too.
Thursday, October 8, 2009
STI Long Term Chart
I was trying to look into the longer term charts to see if I could get anything bullish out of it. However, try as I might, I can't find one at the moment.

We can see the long long term dark yellow channel which STI has been since 1990. The resistance was hit 4 times in the past, and now is the 5th time. It was breached at the 4th hit, but it has since come back down.
If STI still cannot breach this resistance line soon, then things could get quite bad... Perhaps this is the reason why some people are starting to raise shorts.
Shall see as we go along... STI is still doing ranged trading. Perhaps I shall look into S&P 500 to try and see if there's a correlation, since it has been observed that Elliott Waves of larger degrees tend to move in tandem for different indexes.
While there may be further upside, it will be an uphill task. Not wise to buy for super long term at the moment...
Wednesday, October 7, 2009
CapitaLand plans Singapore listing of retail unit
By Shiyin Chen
Bloomberg
CapitaLand Ltd., Southeast Asia’s largest developer, plans to list its CapitaLand Retail Ltd. subsidiary in Singapore to tap growth in Asia’s shopping mall industry.
CapitaLand Retail will be renamed CapitaMalls Asia Ltd. and will have stakes in and manage malls valued at S$20.3 billion ($14.4 billion) as of June 30, the company said in a statement to the Singapore stock exchange today. The unit will take control of CapitaLand’s retail real estate fund and property trust management business.
STI Updates -- Trendlines
The thing about trendlines is, there are always more than 1 set of trendlines to confuse traders. But as the saying goes, Technical Analysis is an art, not a science; there's no right or wrong to it. Thus, different traders and fund managers will have different trendlines, and their decisions will be based on the different charts that they possessed. That might sort of explain why STI get stuck at certain times like now.
Let's try to balance the bull and the bear.
A scary chart for the bulls in the log scale.

This is a chart on the log scale. In this chart, it would probably signify that the bear rally has ended.
Yet, we can also have a chart for bulls in the linear scale.

This second chart shows a possible target of 29xx as well for STI.
Then again, be it bull or bear, the risk/reward ratio isn't very high. Comparing 400 points gain v.s. an expected 1100 points loss in terms of EW count, it would be prudent not to load much of any new holdings for the long term.
Tuesday, October 6, 2009
Thoughts on Financial Freedom -- 1
On Multiple Income Sources
It's Pay Day!
Do you have the feeling of euphoria?
Do you feel like you can finally buy that IPOD you were eying?
Do you feel flushed with cash that you can finally bring your dream girl to an expensive candlelight dinner?
Or are you just happy that your networth has just increased again?
I used to feel happy that I have received my salary month after month, and I looked forward to it month after month. Then it dawned upon me; this habit will get me stucked forever in the rat's race.
Imagine this. A rat is running on a treadmill, trying hard to reach the piece of cheese dangling in front. However, because of the treadmill, the rat can never reach the cheese. And at the end of the run, the cheese is given to the rat as reward. The rat gets a good rest after that. The cycle then repeats next day, and the rat knows that if it carries on, it will get the cheese as food.

Let's bring the analogy to a typical worker. The worker works hard at the job. At the end of the month, he's given a salary as 'reward' for his time. The worker knows that if he continues at this job, he will get his salary month after month.
What's my point? It's bad to get used to a fixed pay cheque every month. That isn't the way to financial freedom! The way to financial freedom is not to be enslaved, and not to be controlled, by a fixed salary. In other words, get used without a fixed salary!
Ok, I know that sounds blur. Probably there will be questions on how to survive without a fixed salary when there are bills to pay, mouths to feed, allowances to give, etc. What I really mean is, to truly achieve financial freedom, we have to secure multiple income sources, and not just rely on a single fixed salary.
Monday, October 5, 2009
STI Elliott Wave Updates
My preferred count so far since the start of the crisis:
From 3906,
5 waves down:
1: 3906 ~ 2746 (10th Oct 07 ~ 17 Mar 08: 5 months)
2: 2746 ~ 3267 (17 Mar 08 ~ 7th May 08: 2 months)
3: 3267 ~ 1474 (7th May 08 ~ 28 Oct 08: 6 months)
4: 1474 ~ 1960 (28 Oct 08 ~ 7th Jan 09: 2 months)
5: 1960 ~ 1455 (7th Jan 09 ~ 10th Mar 09: 2 months)
3 waves up:
A: 1455 ~ 2424 (10th Mar 09 ~ 2nd Jun 09: 3 months)
B: 2424 ~ 2212 (2nd Jun 09 ~ 23 Jun 09: 0.67 months)
C: 2212 ~ 2700??? ====> waiting for hindsight confirmation...
For wave C, the previous post was a possible count. Following on is a second count:
In this count, it looks more likely to be a failed 5th wave on 23rd Sep 09 which ended at 2699 after the ascending triangle breakdown, and equals the 3 months time frame for intermediate A...

The reason why I keep at least 2 counts is because I'm currently unsure of the market. Also, STI is still ranged between 2522 and 2700 at the moment. STI's flattish behaviour seems to have the personality and characteristic of a 4th wave.
However, the fact is, both wave counts now point to a 5 waves down.
Recapping on waves 4 and 5 from wiki
In the count in this post, momentum indicators are showing divergences. Average investors (like me) are indeed buying in. Bears are also ridiculed.
Whether Primary B has ended remains in hindsight. I do need to learn more... Be it FA or TA, insufficient knowledge can always kill.
From 3906,
5 waves down:
1: 3906 ~ 2746 (10th Oct 07 ~ 17 Mar 08: 5 months)
2: 2746 ~ 3267 (17 Mar 08 ~ 7th May 08: 2 months)
3: 3267 ~ 1474 (7th May 08 ~ 28 Oct 08: 6 months)
4: 1474 ~ 1960 (28 Oct 08 ~ 7th Jan 09: 2 months)
5: 1960 ~ 1455 (7th Jan 09 ~ 10th Mar 09: 2 months)
3 waves up:
A: 1455 ~ 2424 (10th Mar 09 ~ 2nd Jun 09: 3 months)
B: 2424 ~ 2212 (2nd Jun 09 ~ 23 Jun 09: 0.67 months)
C: 2212 ~ 2700??? ====> waiting for hindsight confirmation...
For wave C, the previous post was a possible count. Following on is a second count:
In this count, it looks more likely to be a failed 5th wave on 23rd Sep 09 which ended at 2699 after the ascending triangle breakdown, and equals the 3 months time frame for intermediate A...

The reason why I keep at least 2 counts is because I'm currently unsure of the market. Also, STI is still ranged between 2522 and 2700 at the moment. STI's flattish behaviour seems to have the personality and characteristic of a 4th wave.
However, the fact is, both wave counts now point to a 5 waves down.
Recapping on waves 4 and 5 from wiki
Wave 4: Wave four is typically clearly corrective. Prices may meander sideways for an extended period, and wave four typically retraces less than 38.2% of wave three. Volume is well below than that of wave three. This is a good place to buy a pull back if you understand the potential ahead for wave 5. Still, the most distinguishing feature of fourth waves is that they often prove very difficult to count.Both wave counts that I have now fits the above criteria. In the earlier one where a flat is expected, 38.2% retracement is at 2526, and the flat was predicted to reach 2522. STI is also flattish, and the prices are meandering sideways. In addition, the breakdown of the ascending triangle was not coupled with super high volume. This might signify a false break down, and hence still lending hope to bulls that wave 4 has not ended yet... Merely a flat...
Wave 5: Wave five is the final leg in the direction of the dominant trend. The news is almost universally positive and everyone is bullish. Unfortunately, this is when many average investors finally buy in, right before the top. Volume is lower in wave five than in wave three, and many momentum indicators start to show divergences (prices reach a new high, the indicator does not reach a new peak). At the end of a major bull market, bears may very well be ridiculed (recall how forecasts for a top in the stock market during 2000 were received).
In the count in this post, momentum indicators are showing divergences. Average investors (like me) are indeed buying in. Bears are also ridiculed.
Whether Primary B has ended remains in hindsight. I do need to learn more... Be it FA or TA, insufficient knowledge can always kill.
Saturday, October 3, 2009
STI Updates -- More Bull to come?
Today's price action sort of neutralised my more bullish wave counts. The ascending triangle has broken downwards along with the declining volume. This is quite a bearish signal. Taking a leaf from afraidtotrade.com for crude oil which was kindly posted by Dust in CNA forum:


It appears that it's either wave 1 downwards already, or it's still possible that it's merely an expanded flat correction now, and a final wave up is in the works.
Below is yet another possible Elliott Wave count.
Zooming in to the C wave:

It does look possible that a flat or expanded flat correction could be occurring. If that's the case, we would revisit 2522 again before a rebound that brings us past 2707.
Time to observe and learn. Meanwhile, I will be slowly growing my cash via other means.
Friday, October 2, 2009
Portfolio Update
A short update on my portfolio
My portfolio is mostly unchanged. However, I have shifted Starhill Global REIT from trading portfolio to dividends portfolio.
Dividends Basket -- Mainly for dividends
6 lots of SPH @ 3.65
6 lots Capital Commercial Trust @ 0.84
13 lots of CitySpring at 0.51 (7 lots from rights)
32 lots of Macquarie International Infrastructure Fund at 0.352
2 lots of ST Engg at 2.28
10 lots of Starhill Global Reit at 0.54
3 lots of Starhub at 1.91
The total cost here is about $60,494 and the expected average monthly dividends is about $426.
The downturn could be near, and I expect some of these to go into the red region. However, I will continue to hold them, and look forward to average down since my income now allows me to do more of such things.
Investment Basket -- Mainly because I like the business or for growth
5 lots of Breadtalk at 0.37
2 lots of Capitaland at 1.64 (averaged down by selling 1 lot at $3.50 before)
Looking forward eagerly to average down on these. I particularly like the company Breadtalk. Perhaps I shall post some research on this company.
Trading Basket -- Aiming for Capital Gain based mostly on Technicals
30 lots of Hor Kew at 0.125
20 lots of LC Dev at 0.21
2 lots of Cosco at 2.67
I might be looking to cut Hor Kew with some loss.
Someone commented in an earlier post on why I didn't cut Cosco early enough. Indeed, I just can't bear to cut it :(
(i) It was my very first stock bought. No technicals, no fundamentals, just bought blindly. Serves me right. Keeping it here will make it stick out like a sore thumb and remind me everytime of my folly.
(ii) I don't need the money yet, so I can just park it in to collect the dividends. So far, I have collected 70 dollars per lot.
(iii) I have more opportunity cash coming in, so it's still acceptable.
(iv) Cosco is a big company, and in the long run, it will definitely go up to at least $3.
Let's see how it goes then :(
Meanwhile, stock valuations are getting more and more unattractive. I'm shifting some of my salary to repay the CPF Education Loan.
Thursday, October 1, 2009
Possible STI Performance?
I have posted this on CNA forums. It's based on what I think most traders are thinking, an attempt on counter-intuitive psychology.... It's just for fun, so I might likely be wrong
Act 1 Scene 1: Lots of pple waiting for window dressing to sell higher. That means there won't be window dressing... Likely to remain stagnant till Oct...
Act 1 Scene 2: A lot of people are getting cautious of October, so likely to rise up somewhere in October.
Act 1 Scene 3: People start to believe October this year wasn't a bad month after all. All prepare for year end rally, start to buy more and more. Market will then become toppish
Act 1 Scene 4: Indeed Year end rally! Buy more! Market tops. End of final wave. Target timeline: November. Start of wave 1 downwards.
Act 2 Scene 1: People start to sell, believing market has topped. Market u-turns go up for year end rally till Jan. Start of wave 2 upwards.
Act 2 Scene 2: People start to believe market rally hasn't end yet. Buy back some. Some happy that they bought back cheaper. Market turns again for wave 3 down. Feb 2010.
STI Updates

The ascending triangle is getting more and more prominent. Trendlines are converging, Bollinger Band is closing up, GMMA red lines are very close to each other. All indicators are pointing to an imminent break out. The million dollar question is, will this be up or down?
To make a probable guess, I'm relying on other indicators. Firstly we see the Stochastics showing a possible crossing. Secondly, there's positive MACD histogram positive divergence, not that it means a lot yet.
Most importantly, my 2 possible elliott wave counts posted before, and one more alternate count which I have not posted yet, are all telling me that there will be at least one more wave up. What could this wave be?
From chart, we can see an ascending triangle with declining volume. This is a possible coiled spring, and usually, we can expect a strong breakout. 8% breakout to 29xx anyone?
It could be fortunate (on hindsight) that I have not sold my First State Dividend Advantage. Also, reversal to bearish side doesn't seem to be here yet. It looks to me that 2700 might be broken convincingly.
However, although I believe it's likely to have a bullish breakout soon, it would be prudent not to enter into any new mid to long term longs on blue chips. This bullish breakout (maybe only, I might be wrong) might be the last chance to get out with maximal profit.
Subscribe to:
Posts (Atom)