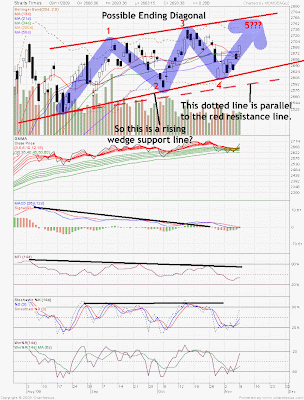
The chart below is my preferred count on the 5th wave of STI.
The dotted line is parallel to the resistance line at the top. Hence, since the support line is at a higher angle, this could mean a rising wedge is being formed, although it is a rather mild one.
Everything seems to start falling in place, or so I hope. The great bear resistance line of 15 years stares down at 2755 region. In a possible 5th wave scenario, the 5th of 5th wave might not reach the resistance line, but instead fall short of it at 2755.
Now that a rising wedge is determined, this fits with what went through my mind yesterday (and also in yesterday's post) about an ending diagonal for the 5th wave.
So here we have, 5 wave counts of a larger degree A of Primary B, as shown in this post. A mild rising wedge that has the potential to break in mid Nov.
As for the mini wave counts (which I'm often wrong), the first wave of the 5th of 5th wave started on 29th Oct 09, 2nd wave ending 2 trading days later, and now we are in the midst of the 3rd.
Wave 1: 2605.1 ~ 2676.95 (71.85)
Wave 2: 2676.95 ~ 2616.49 (60.46)
Wave 3: 2616.49 ~ ????? =========> 2732.34? (1.618 of wave 1)
Wave 4: A possible 2732.34 to 2687.93 as 38.2% retracement before....
Wave 5: ... a final 5th wave to reach 2755?
Let's see how STI behaves.
Could there be any other much much more bullish alternate counts?


No comments:
Post a Comment
Please Comment >>